

The final economic data for 2017 has just been released and it was a good year for Augusta. Employment levels reached record highs with 244,600 people employed in December. Record employment levels were also seen in education and health services (36,200 in October), leisure and hospitality (27,100 in July), professional and business services (39,600 in December) and transportation and utilities (7,800 in October and November). Most sectors of the economy saw employment growth in 2017. The only sectors that witnessed a decline in employment were information and retail.
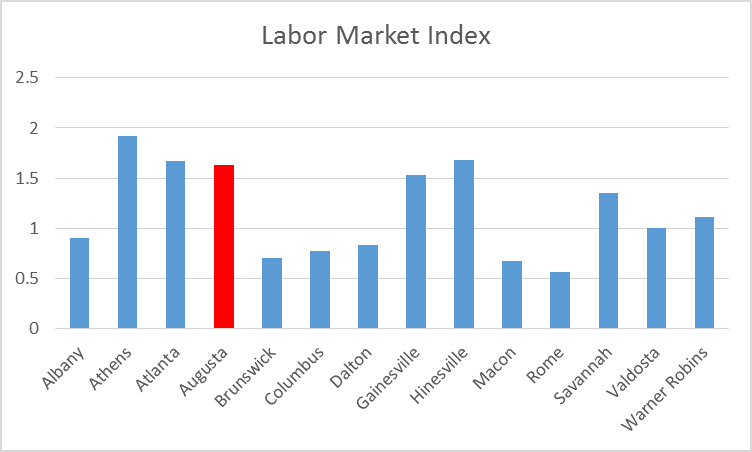
Measuring the state of the local economy includes more variables than just employment. The Labor Market Index (LMI) includes the unemployment rate, labor force, weekly hours worked and weekly wages in addition to employment. The LMI is constructed for all Metropolitan Statistical Areas (MSAs) in Georgia to allow cross city comparisons. The chart below identifies Athens as the MSA with the most robust labor market growth in 2017 at 1.9%. Augusta grew at 1.6% just behind Atlanta and Hinesville at 1.7%.
On February 5th the Dow Jones Industrial Average dropped almost 5% on fears of inflation after newly released data suggested wages were increasing faster than expected. This can also be seen locally where average weekly earnings increased 4.7% in 2017 after two years of declines.
At the Economic Forecast breakfast in December I was asked how the housing market was doing at various price points. At the time I only had average data but thanks to Tom Horner at Blanchard and Calhoun I can now provide a breakdown:
|
House price range |
2017 sales | 2017 average sold price | 2017 Average price per square foot (sold) | 2017 Months of inventory | Days on Market (December 2017) |
| $100k and under | 1,551 | $62,000 | $44 | 3.8 | 100 |
| $100k – $200k | 3,208 | $152,000 | $85 | 2.8 | 104 |
| $200k – $300k | 1,946 | $243,000 | $92 | 4.7 | 136 |
| $300k – $400k | 595 | $341,000 | $102 | 6.1 | 145 |
| $400k -$500k | 174 | $440,000 | $116 | 10 | 199 |
| $500k and above | 126 | $639,000 | $143 | 21.7 | 154 |
Note: Data provided by Trendgraphix via Blanchard and Calhoun
Most of the housing market activity is occurring for houses selling for less than $300,000. Out of the 7,600 houses sold last year 88 percent sold for less than $300,000. At the current rate of sales there is less than five months of inventory of houses priced less than $300,000. On the other hand, there is currently almost 2 years of inventory of houses priced above half a million dollars with higher priced houses staying on the market for longer before selling. Although house sales were higher in 2017 than 2016 for all categories above $100,000 house prices have not changed much suggesting neither a buyers’ nor a sellers’ market dominates.